


Warner Bros. study finds most consumers can’t tell the difference between 4K and 8K
There’s a limit to the resolution that humans can discern on video screens at normal seating distances, and increasing the pixel density beyond that limit offers no advantage.
But where, exactly, is that limit? More specifically, do 8K displays offer any benefit in terms of perceived detail compared with 4K under normal viewing conditions? In collaboration with Pixar, Amazon Prime Video, LG, and the American Society of Cinematographers (ASC), Warner Bros. recently addressed this question in a well-designed, double-blind study to see if people could discern a difference between 4K and 8K with a variety of content.
For the purposes of this article, ‘4K’ refers to a resolution of 3840×2160, and ‘8K’ refers to a resolution of 7680×4320. As you might already know, these definitions are something of a misnomer; to be technically accurate, 4K really means 4096×2160 and 8K means 8192×4320. But these terms have been co-opted by the consumer-electronics industry to apply to the corresponding television resolutions, so that’s how I’ll use them here.

Content selection and preparation
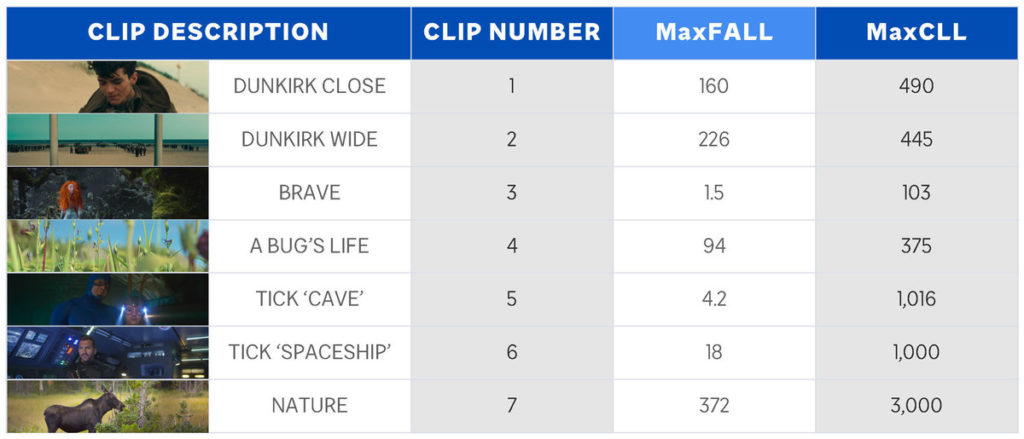
A total of seven clips were prepared, each in native 8K and about 10 seconds long with no compression. Two clips from Warner Bros.’ Dunkirk (8K scans of 70mm film) included a closeup on a character and a wide shot of the beach. Animated clips from Pixar’s Brave and A Bug’s Life were rendered in 8K for this study. And two clips from the Amazon live-action series The Tick – one in a cave and the other in a spaceship – were shot in 8K on a Red digital-cinema camera, as was a clip of nature footage shot by Stacey Spears.
All seven clips were also natively HDR and encoded in HDR10. Fig. 1 lists the HDR10 statistics for each clip.
Each clip was also downscaled to 4K using the industry-standard Nuke post-production software. Then, the 4K clips were upscaled back to 8K using the Nuke cubic filter, which basically duplicates each pixel four times with just a bit of smoothing so the final image is effectively 4K within an 8K ‘container’.
Why upscale the 4K versions back to 8K? Because both versions would be played on the same 8K display in a random manner (more in a moment). In order to play the 4K and 8K versions of each clip seamlessly without HDMI hiccups or triggering the display to momentarily show the resolution of the input signal, both had to ‘look like’ 8K to the display.
Test equipment and procedure
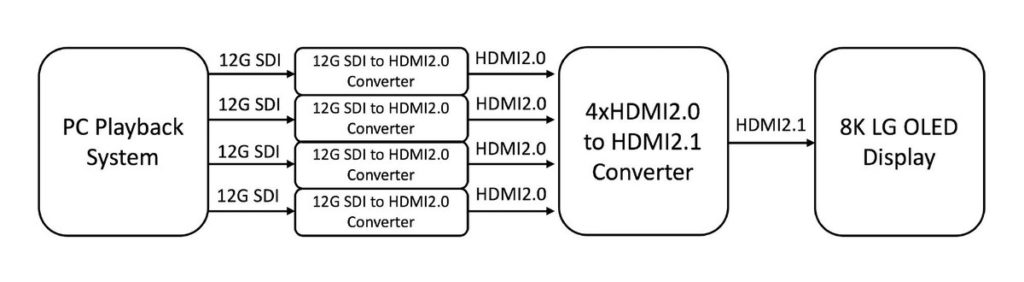
The display on which all clips were shown was an LG 88Z9 88″ 8K OLED TV. All clips were loaded onto a Windows PC with an Intel 18-core i9 CPU, SSD RAID storage, and Nvidia 1080Ti GPU. A BlackMagic 8K Pro video interface sent the video via four 12G SDI links to four AJA Hi5-12G SDI-to-HDMI converters, which output HDMI 2.0. The four converters sent HDMI 2.0 to an Astrodesign SD-7075, which converted them into a single HDMI 2.1 bit stream that was sent to the TV.
The uncompressed files were delivered in the DPX professional format at 24 frames per second progressive (24p). They were encoded with 10-bit precision in BT.2100, which uses the BT.2020 color gamut and PQ EOTF (electro-optical transfer function); this is standard for HDR10. These files require a sustained file-read rate of at least 3Gb/s, which is why such a hefty hardware system was needed.
A total of 139 individuals participated in the study, which was conducted over three days. There were five participants in each session that lasted about 30 minutes. Two participants were in the front row, about five feet from the screen, and three were in the back row, about nine feet from the screen. For context, seven feet from the screen equals two screen heights, and the ITU (International Telecommunication Union) has determined that seven feet is the average viewing distance in the home, regardless of screen size.
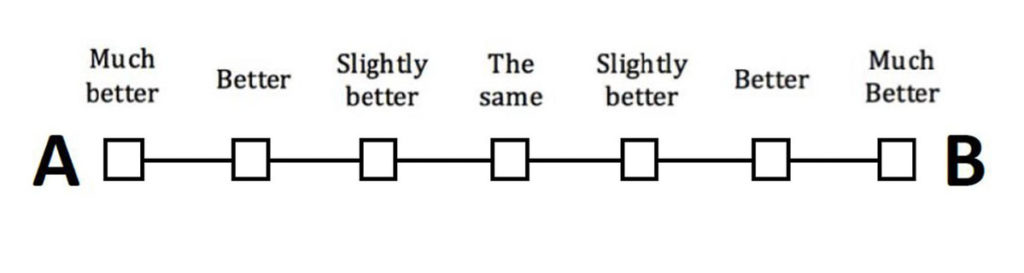
In each session, the 4K and 8K versions of each clip were played in three sequences, though the sequences for each clip were not presented one immediately after another. In two of the sequences, the 4K and 8K versions were randomly assigned the labels ‘A’ and ‘B’ and played twice in an alternating manner – that is, A-B-A-B – after which the participants indicated which one looked better on a scoring form (see Fig. 3). In the third sequence, the 4K version was played four times, though the participants still saw the labels A and B alternate and scored them as before. This provided a control group to assure more robust statistics.
Visual acuity evaluation
Before the testing began, each participant was evaluated for their visual acuity – after all, the study would be pretty meaningless if they didn’t have the ability to perceive fine detail. All were given the standard acuity test using the Snellen eye chart found in optometry offices.
One way to quantify visual acuity is with two numbers expressed as ’20/X,’ where 20/20 is considered normal; that is, at a distance of 20 feet, a person with 20/20 acuity can discern the same level of detail as a person with normal acuity at that distance. An acuity of 20/200 means that, at a distance of 20 feet, you can discern the same level of detail as a person with normal acuity can discern at a distance of 200 feet. Conversely, an acuity of 20/10 means that, at a distance of 20 feet, you can discern the same level of detail as a person with normal acuity can discern at a distance of 10 feet – in other words, better than normal.
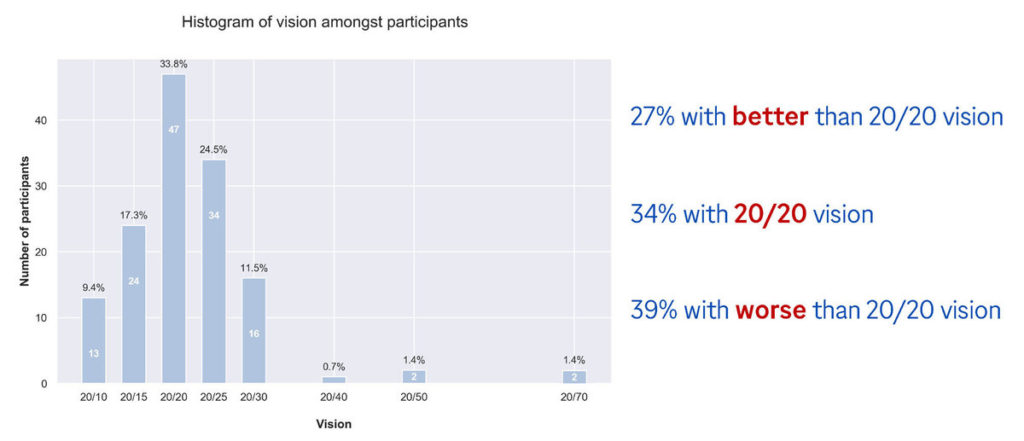
As I would hope for this study, most of the participants had an acuity of 20/20 or better (see Fig. 4): 27% were better than 20/20, 34% were 20/20, and 39% were worse than 20/20, though the vast majority of those were 20/25 or 20/30.
Test results
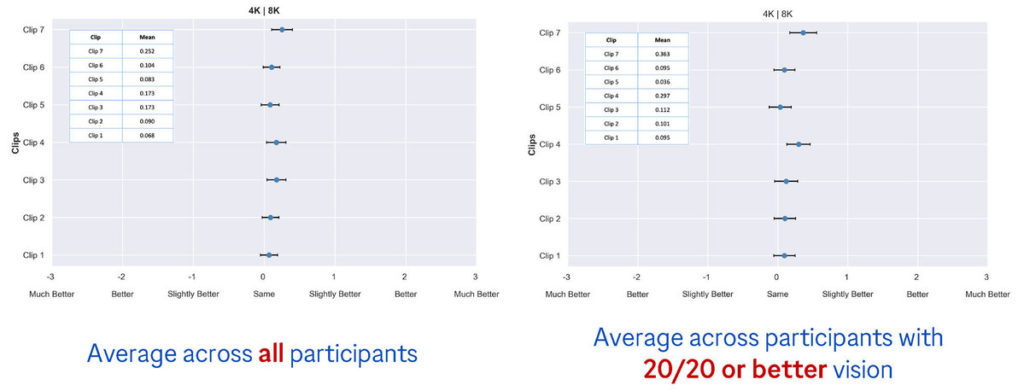
The scores were tabulated in several ways. In the average of all results, the 8K clips were rated ‘marginally slightly better’ than the 4K clips (see Fig. 5). The mean value was no more than 0.252, which is a quarter of the value of ‘slightly better’. Also seen in Fig. 5 are the average results of participants with 20/20 vision or better. In this case, the mean value for some clips leaned slightly more toward 8K but slightly less for other clips.
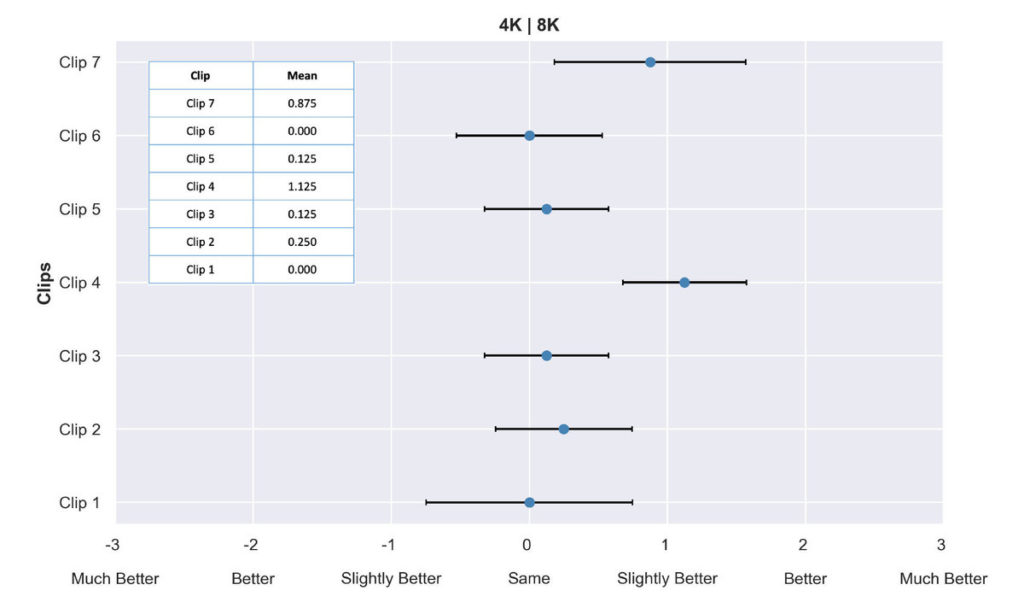
Looking at the average results from participants with 20/10 acuity sitting in the front row (see Fig. 6), the 8K version of two clips – A Bug’s Life and Stacey Spears’ nature footage – scored quite a bit better, right around the full value of ‘slightly better’. The other clips were still a small fraction of that. The results from this group of participants were highlighted specifically because, according to a more technical and precise expression of acuity limits, they were able to fully resolve 8K resolution on an 88″ screen at that distance.
Crunching the numbers in a different way, all ‘slightly better,’ ‘better,’ and ‘much better’ responses were combined into a single ‘better’ score. According to Michael Zink, VP of Technology at Warner Bros. and one of the study’s authors: “The goal here was to take the nuance out of the equation. What might be ‘slightly better’ for one person could potentially be ‘much better’ for another person in terms of perceptual difference. At the core, we wanted to see the difference between people scoring ‘same’ and ‘better’ on any level.” These results are depicted in the right half of Fig. 7.
Another interesting view of the response data is depicted in the left half of Fig. 7. The graph shows the distribution of responses that indicated 4K looked better than 8K, the two versions looked the same, and 8K looked better than 4K. Interestingly, Stacey Spears’ nature footage had a different distribution of scores than the other clips, with more responses rating the 8K version better than the 4K version.
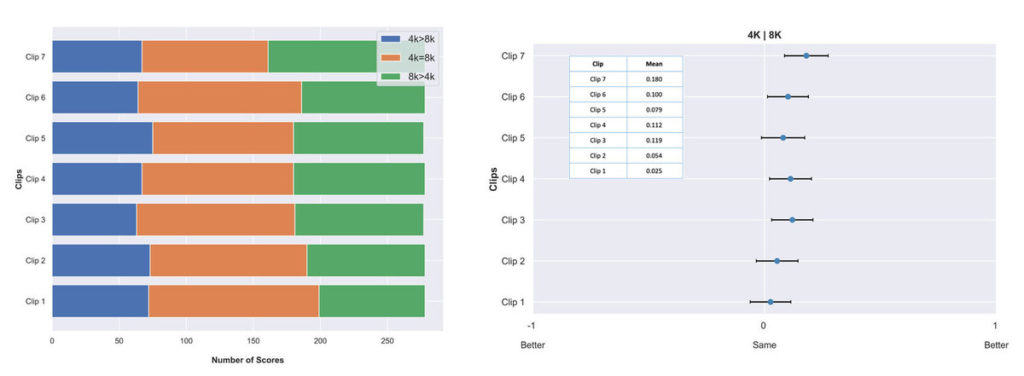
I was amazed to see how many scores rated the 4K version better than the 8K version. When I asked Michael Zink about this, he replied: “I believe the reason you see a large number of people rating ‘4K better than 8K’ is that they really can’t see a difference and are simply guessing. The more interesting point is the fact that for all clips except Clip 7 [the nature footage], most people scored ‘4K the same as 8K’. And ‘8K better than 4K’ is second most scored option. For Clip 7, it’s different, and most people scored ‘8K better than 4K,’ which was an interesting take-away.”
Conclusions
Of course, Zink and his colleagues drew several conclusions from these results. For one thing, increasing spatial resolution from 4K to 8K under typical viewing conditions does not result in a significant visual improvement. Also, a perceptual difference is somewhat dependent on content; in particular, ratings for the clips from Stacey Spears’ nature footage leaned a bit more toward 8K than the others, possibly because it has lots of high-frequency detail.
One thing the study didn’t address is whether the display technology has any effect on the ability to discern 8K. Would the results be any different if the display were an 8K LCD TV rather than an OLED? I suspect not, but it would require a different study to determine objectively.
Perhaps most important, a perceptual difference is dependent on visual acuity and seating distance. Participants with 20/10 acuity in the front row confidently rated the 8K versions of A Bug’s Life and the nature footage higher than the other clips. An ancillary conclusion was that the ITU might want to revise its recommendations about viewing distance to include viewers with 20/10 or 20/15 visual acuity.
This study supports the notion that 8K is only marginally better than 4K in terms of perceived detail – and only with good visual acuity at a relatively close distance from the screen. Otherwise, 4K offers as much detail as the vast majority of consumers can perceive. Even so, I’m sure that TV manufacturers will continue to make 8K TVs and migrate that resolution down into their mid-range models, just as they did when 4K TVs first came out, though I doubt that studios will create much content in native 8K any time soon. So, it all comes down to how well 8K TVs upscale lower resolutions. Perhaps that could be the subject of another study.
IDG News Service


Subscribers 0
Fans 0
Followers 0
Followers