

KDAB, a German consulting firm that develops graphics and visualisation tools, has released Hotspot 1.0, a GUI too for visualising performance data generated by the Linux Perf tool.
Perf analyses system and application behaviours in Linux and generates a detailed report showing which calls, programs, disk I/O operations, or network events (just to name a few possibilities) are eating up most of the system’s time. Because Perf is a command-line tool, most of its output is static, and it can be a multi-step process to produce an interactive, explorable report from data provided by Perf.
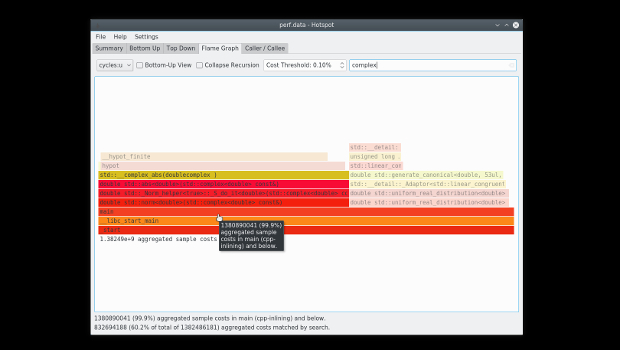
Hotspot—not to be confused with the Java virtual machine project—was developed by one of Perf’s contributors, Milian Wolff, as a partial replacement for Perf’s existing reporting system. It provides an interactive GUI for performance data compiled by Perf, built using the Qt interface library. A tabbed interface provides various views of perf data: basic top-down or bottom-up lists, caller/callee lists, and a flame graph view normally generated with Perf data by way of third-party software.
KDAB claims the resulting interface is far more intuitive to work with, and uses sane defaults: “We always include inline frames and show (in the caller/callee view) the source file and line information.”
Hotspot has a few limitations out of the gate. One is that a number of features in Perf’s default textual reporting mechanisms are not available in Hotspot, such as tracepointing. “This means that it is currently impossible to do off-CPU profiling with hotspot,” says KDAB. Nor does Hotspot provide full details about annotations in traced code. Some missing features are just cosmetic, though, like being able to create user-defined column sets in the various summary views.
Aside from adding in these missing features, Hotspot’s team is planning to present other kinds of performance reports through Hotspot as well, not just data from Perf. Such things could conceivably include performance data generated by language runtimes, e.g., the cProfile tool in Python. “We intend to support various other performance data formats under this umbrella,” the team said on the GitHub project page for Hotspot.
IDG News Service


Subscribers 0
Fans 0
Followers 0
Followers